Introduction
In investment banking, a single-point valuation estimate is never the final answer. Every DCF, every LBO model, and every merger model must be accompanied by analysis showing how the output changes under different assumptions. Sensitivity analysis and scenario analysis are the two tools that transform a model from a point estimate into a defensible range, and both appear in virtually every pitchbook, board presentation, and fairness opinion deliverable.
Sensitivity Analysis: The Two-Variable Data Table
What It Does
Sensitivity analysis varies one or two inputs mechanically across a range to show how a single output (implied enterprise value, equity value per share, IRR) changes. The analyst does not change the full assumption set; they isolate one or two key variables and show the output across a grid of values.
How to Build It in Excel
Excel's Data Table function (Data > What-If Analysis > Data Table) is the standard tool. The analyst sets up a grid with one input variable along the top row and another along the left column. The output cell (e.g., implied share price) is referenced in the corner. Excel then calculates the output for every combination of the two inputs automatically.
Standard Sensitivity Pairings
| Model Type | Primary Pairing | Secondary Pairing |
|---|---|---|
| DCF | WACC vs. terminal growth rate | WACC vs. exit multiple |
| LBO | Entry multiple vs. exit multiple | Leverage vs. EBITDA growth |
| Merger | Purchase premium vs. synergy level | Cash/stock mix vs. synergies |
Presentation Format
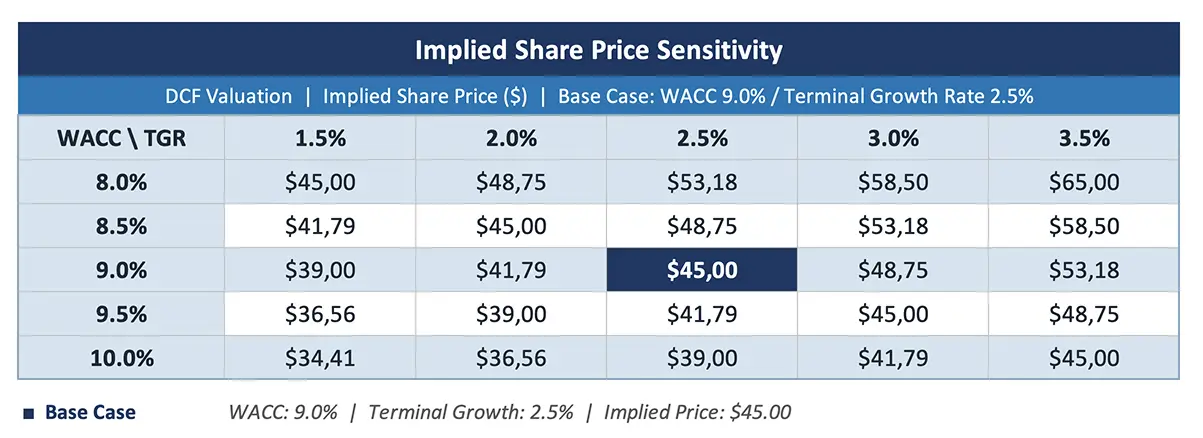
The sensitivity table is typically formatted as a matrix with:
- The base case cell highlighted (bold, shaded, or outlined)
- The "reasonable range" shaded in a lighter color
- Extreme values at the corners (which may be unrealistic but provide bounds)
- Clear labels for both axes (e.g., "WACC" across the top, "Terminal Growth Rate" down the left)
Scenario Analysis: Complete Alternative Cases
What It Does
While sensitivity analysis varies inputs mechanically, scenario analysis builds complete, internally consistent alternative cases. Each scenario tells a coherent story about the business under different conditions:
- Base case: The most likely outcome, based on management guidance and the analyst's best judgment
- Upside case: Favorable conditions (higher growth, faster margin expansion, lower WACC, multiple expansion)
- Downside case: Adverse conditions (recession, competitive disruption, margin pressure, higher WACC)
Why Internal Consistency Matters
A scenario must change multiple assumptions simultaneously to tell a coherent story. A recession scenario should reduce revenue growth AND compress margins AND potentially increase WACC (as risk premiums widen). Simply reducing revenue growth by 2% while holding everything else constant is a sensitivity, not a scenario.
- Scenario Analysis
A technique that models complete, internally consistent alternative cases (base, upside, downside) by changing multiple assumptions simultaneously to reflect different economic, competitive, or operational environments. Unlike sensitivity analysis (which varies one or two inputs mechanically), scenario analysis requires judgment about how variables interact and co-move. Each scenario produces a full set of financial projections and a corresponding valuation, providing decision-makers with a range of outcomes that reflects genuine uncertainty.
Building Scenarios in Excel
The most common approach is to create a scenario toggle on the assumptions tab: a single cell that switches between "Base," "Upside," and "Downside." Each assumption cell uses an IF or INDEX/MATCH formula to pull the appropriate value based on the selected scenario. This allows the entire model to switch between scenarios with a single click.
More sophisticated models use Excel's Scenario Manager or build separate assumption columns for each scenario, with the active scenario selected via a dropdown.
Tornado Charts: Ranking Assumptions by Impact
A tornado chart is a horizontal bar chart that ranks variables by their impact on the output. Each variable is shown as a bar extending left (downside) and right (upside) from the base case value, with the longest bars representing the most influential assumptions.
Tornado charts answer the question: which assumption matters most? If the implied share price swings $5 when WACC moves 50 basis points but only $1 when revenue growth changes by 2 percentage points, the analyst (and the client) knows that the WACC assumption deserves more scrutiny than the revenue growth assumption.
While data tables are the standard sensitivity format in banking, tornado charts are increasingly used in investment committee presentations and board materials because they immediately communicate the hierarchy of assumptions.
Combining Sensitivity and Scenario Analysis
Best practice presents both techniques together:
- Sensitivity tables show the mechanical relationship between key inputs and the output, helping the reader understand what drives the number
- Scenario analysis shows three complete valuation cases (base, upside, downside), helping the reader understand the range of realistic outcomes
The scenario-based range (base to upside, base to downside) typically feeds into the football field chart as the DCF bar, while the sensitivity tables appear as supporting exhibits that explain why the range is what it is.
The Tornado Chart: Ranking Assumptions by Impact
A tornado chart (also called a waterfall sensitivity chart) ranks assumptions by their impact on the output. The analyst varies each assumption individually (holding others at base case) and plots the resulting change in enterprise value as a horizontal bar. The assumption with the widest bar (greatest impact) appears at the top, with subsequent assumptions ordered by decreasing impact.
- Tornado Chart (Sensitivity Waterfall)
A horizontal bar chart that ranks model assumptions by their individual impact on the output. Each bar shows how much the implied value changes when that specific assumption moves from its low to high end while all other assumptions remain at base case. The assumption with the widest bar has the greatest influence on the valuation and deserves the most analytical attention. In a typical DCF, the terminal growth rate and WACC dominate the tornado chart, with revenue growth and terminal year EBITDA margin as secondary drivers. Tornado charts help MDs and clients quickly identify "what matters most" in the valuation without reading through the full sensitivity tables, and they focus the discussion on the assumptions where judgment has the largest dollar impact.
Tornado charts are particularly useful in client presentations because they answer the intuitive question "what drives this number?" in a single visual. An MD presenting to a board can point to the tornado chart and say: "The implied value is most sensitive to the exit multiple and WACC. If you believe the exit multiple is 11x rather than 10x, the value increases by approximately $500 million. Revenue growth is a secondary driver: each percentage point of additional growth adds approximately $200 million to the output." This level of specificity grounds the abstract valuation in concrete, debatable assumptions.


