Introduction
Formatting is not a cosmetic afterthought in financial modeling. It is the system that makes a model readable, auditable, and trustworthy. In investment banking, models are built by analysts, reviewed by associates and VPs, presented by MDs, and sometimes used by clients and counterparties. Every person in this chain must be able to open the model and immediately distinguish inputs from formulas, identify key outputs, and trace the logic without needing the original builder to explain it.
The formatting conventions described here are universal across investment banks. While specific banks may have minor variations (slightly different shade of blue, different treatment of certain line items), the core system is the same everywhere. Mastering these conventions from Day 1 demonstrates professionalism and attention to detail.
The Color System
The Three Core Colors
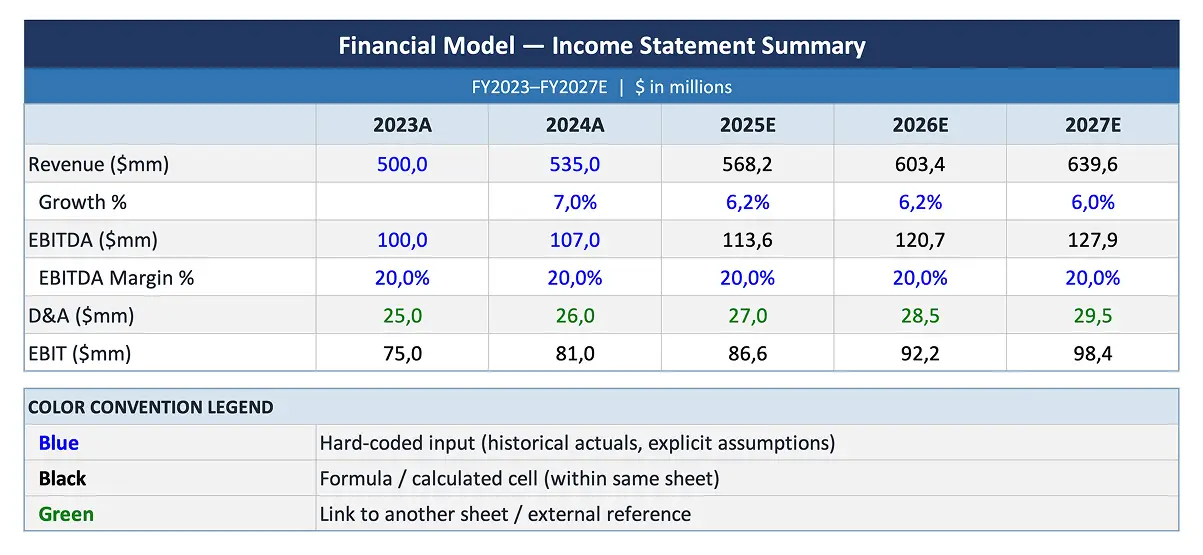
| Color | What It Marks | Why It Matters |
|---|---|---|
| Blue font | Hard-coded inputs (any value typed directly into a cell) | Tells the reviewer "this is an assumption that can be changed" |
| Black font | Formulas that reference cells within the same sheet | Tells the reviewer "this is calculated, do not overwrite" |
| Green font | Formulas that reference cells on a different sheet | Tells the reviewer "this pulls from another tab; check the source" |
Some banks add a fourth color:
- Purple font: Links to cells in a different Excel file (external references). These are flagged because external links can break when files are moved or renamed.
And a functional color:
- Red font or red fill: Flags items that need attention, contain errors, or are placeholders that must be updated before the model is final.
Historical vs. Forecast Periods
An additional color convention distinguishes time periods:
- Historical data: Blue font (it is a hard-coded input based on reported financial data)
- Forecast/projection data: Black font (it is calculated from assumptions and formulas)
The transition from blue (historical) to black (projected) visually marks the boundary between fact and forecast, which is one of the most important distinctions in any financial model.
Number Formatting
Standard Formats
- Dollars: Expressed in millions with one decimal place ($1,234.5) or no decimals for round numbers. Always specify the unit (millions, billions) in the header row.
- Percentages: One decimal place (25.3%), with the percent sign. Growth rates, margins, and rates all use this format.
- Multiples: One decimal place followed by "x" (11.2x). Never use "times" or leave the number without the "x" suffix.
- Share counts: Expressed in millions with one decimal (150.3 million shares).
- Negative numbers: Use parentheses, not minus signs. ($45.2) is correct; -$45.2 is not. Parentheses are the universal accounting convention for negatives and are more visually distinctive.
- Formatting Consistency
The principle that every element in a financial model (colors, number formats, indentation, line spacing, header styles) follows a single, documented standard applied uniformly throughout the entire workbook. Consistency allows any reviewer to develop expectations about how information is presented and to spot anomalies (a cell in the wrong color, a number with too many decimals) that may indicate errors. Inconsistent formatting undermines trust in the model because it signals carelessness, which raises doubts about the accuracy of the calculations.
Line Item Presentation
- Bold: Major line items (Revenue, EBITDA, EBIT, Net Income, Free Cash Flow) and section totals
- Indent: Sub-items under major categories (individual expense lines under Operating Expenses, individual debt tranches under Total Debt)
- Borders: A single line above subtotals, a double line above grand totals. This mirrors the presentation in audited financial statements.
- Shading: Use sparingly. Light gray shading for header rows or input sections. Avoid heavy color fills that reduce readability.
Structural Formatting
One Formula Per Row
The formula in the first forecast period cell should be copyable across all periods without modification. If Year 1 uses a different formula than Year 2, the model is harder to audit and more prone to errors. Design formulas using IF statements or switches to handle the first period's unique treatment while maintaining a single formula structure.
No Hard-Coded Values in Formula Cells
Every input should flow from the assumptions tab. If a formula cell contains a hard-coded number (e.g., a growth rate typed directly into a revenue formula), it is invisible to anyone reviewing the assumptions tab and will likely be missed when assumptions are updated. This is one of the most common and most dangerous modeling errors.
Sign Conventions
Establish at the start of the model whether costs are entered as positive or negative values, and maintain the convention consistently. The two common approaches:
- All positive, subtract in formulas: Revenue is positive, COGS is positive, and the formula subtracts COGS from Revenue to get Gross Profit. This is more intuitive for the builder.
- Natural signs: Revenue is positive, costs are negative. The formula simply sums all line items. This is more intuitive for the reviewer because the sign of each line item matches its economic impact.
Either approach works as long as it is applied consistently and documented.
Documentation and Navigation
Comments and Notes
Use Excel comments to explain non-obvious formulas, document data sources for inputs, and flag areas that require updating. A comment on the revenue growth cell might read: "Source: management guidance from Q3 2025 earnings call. Update after Q4 results."
Table of Contents
For complex models (30+ tabs), include a Table of Contents tab with hyperlinks to each section. This is essential for models that will be shared with clients or used by multiple team members.
Version History
Maintain a version log (on the cover tab or a dedicated tab) noting the date, analyst name, and key changes for each version. This prevents the "which version is current?" problem that plagues large deal teams.


