Introduction
If valuation is the core analytical skill in investment banking, the football field chart is its most recognizable visual output. Named for its resemblance to an American football field, this horizontal bar chart places the implied valuation range from each methodology side by side on a single slide, allowing everyone in the room to instantly see where the analysis converges and where it diverges. It is one of the most common slides in any investment banking pitchbook, fairness opinion, or board presentation.
The football field chart is not just a presentation tool. It is the moment where all the analytical work (comps, precedent transactions, DCF, LBO) comes together into a single visual that frames the negotiation, supports the recommendation, and often determines the price range for a transaction. Understanding how to build, read, and interpret a football field chart is essential for every investment banking analyst.
What the Football Field Chart Shows
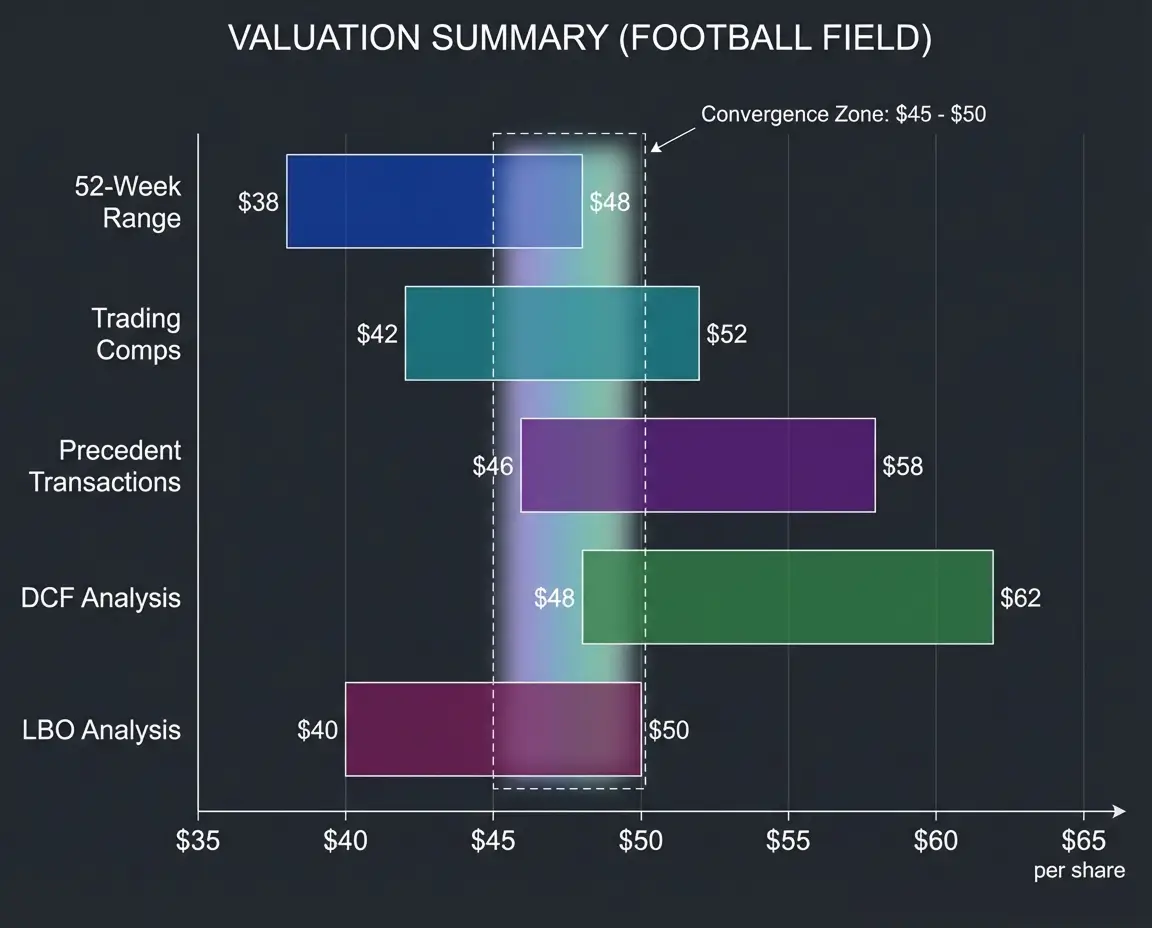
The chart displays horizontal bars, one for each valuation methodology, plotted on a common axis. The axis represents either share price (for public company valuations) or enterprise value (for private company or M&A valuations). Each bar spans the range of implied values from low to high for that methodology, with the midpoint often marked.
A typical football field includes five to seven bars representing different methodologies and reference points:
- 52-Week Trading Range: The stock's high and low prices over the past year. This is a market-based reference point, not an analytical methodology, but it provides important context for how the market has valued the company recently.
- Trading Comps: The implied valuation range from comparable company analysis, typically showing the range from the 25th percentile to the 75th percentile of peer multiples applied to the target's metrics.
- Precedent Transactions: The implied range from precedent transaction analysis, which usually sits above trading comps because transaction multiples include control premiums.
- DCF Analysis: The implied range from discounted cash flow analysis, often showing sensitivity to key assumptions like the discount rate and terminal growth rate or exit multiple.
- LBO Analysis: The implied range based on what a financial sponsor could pay at different leverage levels and return targets. This typically represents the valuation floor.
- Analyst Price Targets: The range of Wall Street equity research analyst targets. Like the 52-week range, this is a reference point rather than an independent methodology.
- Football Field Chart
A horizontal stacked bar chart used in investment banking to display the implied valuation range from multiple methodologies on a single slide. Each bar spans the low-to-high range for one method, plotted on a common share price or enterprise value axis. The chart's power lies in visual triangulation: where bars overlap, confidence in the valuation range is highest; where they diverge, further analysis or judgment is required. Also called a valuation summary chart or valuation range chart.
How to Read and Interpret the Chart
Convergence Signals Confidence
The most important information on a football field chart is not any individual bar. It is the zone of overlap where multiple methodologies agree. If trading comps imply $40-48 per share, precedent transactions imply $45-55, the DCF implies $42-52, and the LBO floor is $38, the convergence zone around $45-48 represents the strongest analytical support for the valuation. A banker presenting this to a board can point to that overlap and say: "Three independent methodologies agree that the business is worth approximately $45-48 per share."
Divergence Demands Explanation
When bars do not overlap, the divergence tells a story that the banker must explain. Common patterns and their explanations:
- DCF above comps: The market may be undervaluing the company (the fundamental analysis sees more value than the market prices in), or the DCF assumptions may be too aggressive.
- Precedent transactions well above everything else: Historical deals may have occurred in a frothier market, or buyers may have paid premiums driven by synergies or competitive dynamics that do not apply to the current situation.
- LBO well below other methods: The current debt markets may be constraining leverage, compressing the price financial buyers can afford. This is common in high-rate environments.
- Wide range within a single methodology: A DCF bar spanning from $35 to $65 signals high sensitivity to assumptions, suggesting the company's cash flows are difficult to predict or the terminal value assumptions are uncertain.
Where the Football Field Appears
In Pitchbooks
During the marketing phase (before winning the mandate), the football field appears in the valuation section of the pitchbook. At this stage, the analysis may be based on publicly available information and preliminary assumptions. The chart helps the bank demonstrate its analytical capabilities and frame its strategic recommendation to the prospective client.
In Board Presentations
Once the bank is engaged, a more refined football field appears in presentations to the client's board of directors. This version incorporates management projections, updated market data, and more detailed analysis. The board uses it to set expectations for the transaction price and to evaluate incoming bids against the analytical framework.
In Fairness Opinions
The football field chart is a central exhibit in any fairness opinion. The bank presenting the opinion walks the board through each bar, explaining the methodology, key assumptions, and implied range. The chart demonstrates that the bank performed a comprehensive, multi-methodology analysis, and that the transaction price falls within the range supported by the analysis. In litigation, the fairness opinion football field is often the most scrutinized document, with plaintiffs' attorneys examining whether any methodology was excluded or whether ranges were selectively narrowed.
In Negotiation Strategy
Internally, the football field informs the negotiation strategy. On a sell-side mandate, the banker uses the chart to identify the target price range and the walk-away price. On a buy-side mandate, the chart establishes the maximum offer price and helps the acquirer understand where different types of sellers are likely to anchor.
Building the Football Field: Practical Considerations
Unit Selection: Share Price vs. Enterprise Value
For public company valuations, the axis is typically share price, because the client (the board) and the market think in per-share terms. The offer in an M&A deal is expressed as a price per share, and the board evaluates it relative to the current stock price and 52-week range.
For private company valuations, the axis is enterprise value, because there is no public share price to anchor on. In these situations, the football field may also show implied equity value or implied equity value per share (if the ownership structure supports it).
Sensitivity Ranges Within Each Bar
Each bar on the football field represents a range, not a single point. The range is driven by different factors depending on the methodology:
| Methodology | What Drives the Range |
|---|---|
| Trading Comps | Peer group selection and percentile cutoffs (25th to 75th) |
| Precedent Transactions | Time period, transaction type, and outlier handling |
| DCF | Discount rate range and terminal value assumptions |
| LBO | Leverage assumptions and IRR targets (e.g., 18-22% vs. 22-25%) |
| 52-Week Range | Simply the observed high and low prices |
Ordering and Visual Hierarchy
Bars are typically ordered from lowest to highest implied value, or by methodology type (market-based, then transaction-based, then intrinsic). Consistency across presentations within a bank is important, as clients and managing directors expect a familiar layout.
The Football Field in Interview Context
Interviewers rarely ask candidates to build a football field from scratch, but they frequently ask questions that require understanding it:
"Which valuation method typically gives the highest value?" The standard answer is that precedent transactions typically produce the highest implied value (because of control premiums), followed by DCF (which depends on assumptions), then trading comps (which reflect the current market without a premium), with LBO analysis typically at the bottom (because financial buyers are constrained by target returns and leverage capacity). However, this ordering is not fixed, and candidates should explain the circumstances under which it could change.
"Why might the DCF give a lower value than trading comps?" If the market is overvaluing the peer group (during a bubble), or if the company's growth projections are conservative relative to what the market is pricing in, the DCF can fall below comps. This shows the interviewer that you understand the DCF reflects your assumptions while comps reflect the market's consensus.


