


Overview
On October 10, 2007, an investor group led by KKR, TPG, and Goldman Sachs Capital Partners closed the take-private of TXU Corp., the largest electric utility in Texas, at $69.25 per share in cash. The total transaction value was approximately $45 billion, including assumed debt. It was the largest leveraged buyout in history at announcement, and it remains the largest seventeen years later. Seven years after close, on April 29, 2014, the renamed Energy Future Holdings filed for Chapter 11 with roughly $42 billion of debt outstanding. The sponsor consortium's ~$8 billion of equity was wiped out completely.
The interesting question is not whether the deal failed. The numbers settle that. It is why the largest leveraged buyout ever attempted, by the most experienced sponsors at the peak of a benign credit cycle, broke so totally, and what the wreckage says about a leveraged bet on a single commodity price. This study reconstructs the deal from the SEC filings, the sponsors' own statements, the bankruptcy record, and the press coverage that argued with the thesis in real time.
How TXU Became a Buyout Target
The most interesting fact about the TXU deal is that the company was effectively in play before any banker pitched it, because the chief executive's own four-year turnaround had pushed the equity to a valuation that no public-market story could justify staying public to deliver.
C. John Wilder, the turnaround that made the company too valuable to stay public
C. John Wilder was named president and CEO of TXU on February 23, 2004, into a company that had only narrowly avoided default during the European utility-spin disaster of 2002 and that traded near book value. Wilder restructured the balance sheet, sold off non-core international and broadband assets, cut operating costs aggressively, and returned capital through buybacks. The result was operating leverage at exactly the moment Texas wholesale electricity prices were rising. TXU's share price rose roughly 400% from his arrival to early 2007, per the BSIC retrospective and the D Magazine post-mortem.
The peculiar consequence was that the turnaround made the equity too rich for a public-market story to keep going. Wilder had executed the available levers; the next move had to be either a controversial expansion (Texas coal build-out) or a strategic transaction. The first attempt at expansion provoked a public-policy backlash; the second became the LBO. Wilder himself collected his contract proceeds at deal close in October 2007 and departed within days. He was the architect of the equity value the LBO captured, not a participant in the buyout itself.
Why Texas mattered: ERCOT and gas as the marginal fuel
The bull case on TXU's equity was structurally a Texas-specific bet. The Electric Reliability Council of Texas (ERCOT) is the only state-scale wholesale electricity market in the United States that operates as an "energy-only" market and is not synchronized with the federal grid. Clearing prices in ERCOT reflect the marginal cost of the last generator dispatched, and in Texas that marginal generator is overwhelmingly a natural-gas turbine. The pricing dynamic is precise: when gas is expensive, ERCOT clearing prices are high; when gas collapses, clearing prices follow it down.
TXU's generation fleet was unusual. Its competitive subsidiary (later renamed Luminant) owned a coal and nuclear baseload portfolio whose marginal cost was substantially below the gas-fired plants setting the price. The wider the spread between gas-driven clearing prices and TXU's own marginal cost, the higher the company's gross margins. The same fleet in a different US power market would have been a less compelling LBO target. The Texas wholesale-market structure is what turned a thesis on natural gas into a thesis on TXU.
- ERCOT energy-only market
A wholesale electricity market in which generators are paid only for the energy they actually deliver, with no separate capacity payments. Clearing prices are set by the marginal unit dispatched, so the market's pricing is unusually sensitive to the cost of the marginal fuel. In Texas, that marginal fuel is almost always natural gas.
The 2006 coal-plant fight that put TXU in play
In 2006, under Wilder, TXU filed permit applications for 11 new pulverized-coal-fired power plants in Texas. The plan would have nearly doubled the state's coal-fired generation fleet at exactly the moment that climate and air-quality concerns were rising in the public conversation. The Environmental Defense Fund (EDF) and the Natural Resources Defense Council (NRDC) led an organized opposition that produced lawsuits, regulatory delay, and reputational drag on the equity. Mayors of Dallas, Houston, Fort Worth, and Austin came out against the build-out. Construction-finance commitments from banks began to look more tentative.
The strategic signal to potential acquirers was clear before any deal process opened. A public-utility CEO who has been rebuffed publicly on a multi-billion-dollar expansion plan is a CEO whose company is ripe for a private-market structure. By late 2006 TXU was already, in the language of M&A bankers, "in motion."
The Sponsors' Thesis
The deal that became the largest LBO in history was not a financial-engineering exercise looking for a target. It was a thesis on a commodity price, structured as a take-private because public markets could not have funded the leverage required to express it.
A leveraged bet on natural gas staying expensive
Natural-gas prices at the Henry Hub benchmark had risen from roughly $5 per MMBtu in early 2002 to over $13 in 2005-06, driven by tight North American supply, demand from a growing power sector, and hurricane-related disruptions in 2005. The sponsor case treated this elevation as structural: domestic conventional reserves were declining, LNG infrastructure was inadequate, and the cost of new gas-fired build was rising. Coal and nuclear generation, by contrast, had a known and lower marginal cost that did not move with gas. TXU's coal-and-nuclear fleet selling into an ERCOT market priced off gas would, on the sponsors' model, earn a structurally widening spread for years.
The leverage was the multiplier. Sponsors put up roughly $8 billion of equity against approximately $40 billion of new debt financing, a ratio of roughly 5:1. If the gas-coal-nuclear spread held, the equity returns on a five-year hold would have been spectacular. If the spread collapsed, the equity would be at risk before the operating cash flows could absorb the loss. There was no middle scenario in which the deal was merely disappointing.
The environmental settlement that bought the political license
Before the deal was announced, KKR and TPG negotiated in private with EDF's regional director Jim Marston and the NRDC over the future of the coal-plant build-out. The bargain that emerged was unprecedented in M&A. The sponsors agreed to cancel 8 of the 11 proposed Texas coal plants, halt plans for coal-fired plants in Pennsylvania and Virginia, support federal cap-and-trade legislation, double the company's energy-efficiency spending, and cut residential electricity rates by 10%, per the NRDC announcement. In return, EDF and NRDC agreed not to campaign against the remaining three coal plants or against the deal itself.
The pre-deal stakeholder bargain converted a regulatory and political risk into a deal feature. It was the first time a major LBO had been engineered around an explicit climate-and-environmental settlement, and it set a template that subsequent infrastructure and energy-sector PE deals have followed in different forms.
- Cap-and-trade
A market-based emissions-control mechanism in which a regulator sets a total cap on a pollutant and issues a fixed number of permits; emitters can trade permits among themselves, so the cost of reducing emissions falls on those who can do so most cheaply. In 2007 the prospect of US federal cap-and-trade legislation was widely expected; the sponsors' commitment to support it was a real concession.
The political bargain in Austin
The Texas-side political negotiation was just as careful. Sponsors committed to a 10% reduction in residential electricity rates, a price cap on residential rates through 2008, a commitment to maintain headquarters in Dallas, and continued contributions to public-policy initiatives in the state. Texas regulators and the legislature, who had every doctrinal reason to be suspicious of a leveraged take-private of the state's largest utility, were given concrete benefits and a structural concession: the regulated transmission and distribution business (Oncor) would be ring-fenced from the competitive generation and retail businesses, so that consumer-facing utility credit could not be hurt by the leveraged competitive entity.
Pricing the Largest LBO Ever
The deal mechanics themselves followed a recognizable PE-2007 template, with a few features (an unusually thorough go-shop, a heavy reverse-breakup structure) that reflected both the sponsors' confidence and the regulatory profile of a state's largest utility.
$69.25 per share, with a real go-shop
The deal was announced on February 26, 2007 at $69.25 per share, a roughly 25% premium to the 20-day average closing price and a 20% premium to the unaffected close on February 22, the last trading day before press speculation about the deal. The agreement contained a 50-day go-shop period through April 16, 2007, during which TXU's bankers solicited interest from more than 70 potential acquirers, including US utilities, non-US utilities, other energy companies, and financial sponsors. The breakup-fee structure was tiered to encourage that outreach: a $1.0 billion termination fee outside the go-shop window, $375 million for a topping bid that emerged inside it. Background on how these fees actually shape an auction is in our explainer on break-up and termination fees.
No superior proposal emerged. The go-shop closed with TXU's board confirming that the original agreement remained the highest credible offer. The result was both a procedural validation of the price (the equivalent of a market check) and a signal of how few buyers could actually finance a deal of this scale at peak-cycle valuation.
The capital structure and the five-bank syndicate
The combined sponsor consortium put up approximately $8 billion of equity, drawn from KKR, TPG, and Goldman Sachs Capital Partners, plus co-investors Lehman Brothers, Citigroup, and Morgan Stanley. The debt was arranged by a consortium of the same five investment banks (Citigroup, Goldman Sachs, JPMorgan, Lehman, Morgan Stanley) and structured in layers: roughly $24.5 billion of senior secured credit facilities at the competitive subsidiary TCEH, a $6.75 billion TCEH unsecured bridge, a $4.5 billion EFH-level unsecured bridge, plus existing assumed debt that brought the post-close total to approximately $40 billion.
The 80/20 ratio of debt to equity was the choice that ultimately broke the deal. A conservative 60/40 structure would have given the equity room to absorb a 50% collapse in gas prices without forcing default. The 80/20 structure compressed the equity's margin of safety to near zero against the commodity exposure. The financing was raised at peak credit-cycle conditions, when LBO covenant packages were unusually light and pricing was tight, but capital structure is a permanent feature; what looked like cheap financing in 2007 was the same financing that became unsustainable in 2011.
| Term | Detail |
|---|---|
| Announced | Feb 26, 2007 |
| Closed | Oct 10, 2007 |
| Equity value | ~$32.1B (≈462M shares × $69.25) |
| Enterprise value | ~$45B (incl. assumed debt) |
| Per share | $69.25 all-cash |
| Premium to unaffected close | ~20% |
| Sponsor equity check | ~$8B |
| New debt financing | ~$40B |
| Termination fee (outside go-shop) | $1.0B |
| Termination fee (inside go-shop) | $375M |
| Sponsor advisers | Citigroup, Goldman Sachs, JPMorgan, Lehman, Morgan Stanley |
| TXU advisers | Credit Suisse, Lazard |
The deal architecture that ring-fenced Oncor
The post-close corporate structure was deliberate. Energy Future Holdings (EFH) was the top-level holding company. Beneath it sat two parallel silos: Texas Competitive Electric Holdings (TCEH), holding the generation, wholesale, and retail businesses (the Luminant generation arm, TXU Energy retail), and Energy Future Intermediate Holding (EFIH), holding the stake in Oncor Electric Delivery, the regulated transmission and distribution business and the state's largest utility by customers. Each silo had its own debt; creditors of each silo had no recourse to the other.
Go-shop period closes
April 16, 2007. No superior proposal emerges from 70+ contacted bidders.
Financing commitments locked
Summer 2007. Five-bank syndicate underwrites ~$40B of debt.
Shareholders approve
September 7, 2007. The vote is overwhelming.
Regulatory approvals
September-October 2007. Public Utility Commission of Texas and FERC sign off; environmental-group commitments incorporated.
Close
October 10, 2007. TXU renamed Energy Future Holdings; $8B equity injected, debt drawn.
Corporate structure stood up
Oct-Dec 2007. TCEH (competitive) and EFIH/Oncor (regulated) silos formally separated, with no cross-recourse.
The ring-fence was the single most important structural decision of the deal, and the one that ultimately determined the shape of the bankruptcy seven years later.
When Shale Broke the Thesis
The first two years of the deal looked exactly like the sponsor model. Then a US energy-supply revolution that few outside the upstream industry had modeled at scale rewrote the natural-gas-price curve and, with it, the EFH thesis.
The 2008 peak that vindicated the bet, briefly
Henry Hub natural-gas prices climbed through 2007 and into 2008, peaking around $13 per MMBtu in summer 2008. ERCOT clearing prices followed gas higher; TXU's coal and nuclear baseload, with its lower marginal cost, captured exactly the spread the sponsors had modeled. The pre-close hedge program layered in by TCEH had locked significant chunks of 2008-2010 generation at elevated prices, providing additional cash-flow protection. On the company's first full fiscal year post-close, the deal looked validated.
The hedges were the key. By hedging 2008-2010 production, TCEH had secured the cash flows that would fund debt service through the first three years. The structural risk was what happened after the hedges rolled off. The sponsor model assumed that gas prices would remain elevated through 2011-2013 and that the hedge book could be rolled forward on similar economics. That assumption depended on a North American gas-supply curve that, even in 2008, was already being rewritten in west Texas and Pennsylvania.
The Barnett, the Marcellus, and the supply shock
Hydraulic fracturing combined with horizontal drilling, refined in the Barnett Shale of north Texas over the late 1990s and early 2000s by Mitchell Energy and others, transformed US natural-gas economics. The Barnett accounted for most of the early shale production. Producers then took the techniques learned there to the Marcellus Shale in Appalachia, the Haynesville in Louisiana and East Texas, and the Eagle Ford in South Texas. Between 2008 and 2012, US dry natural-gas production rose roughly 19%, from about 20.2 trillion cubic feet to about 24.1 trillion cubic feet, per EIA data. By 2012 the Marcellus alone had become the largest single source of US natural-gas production, per the Dallas Fed and RBN Energy.
The price consequence was direct. Henry Hub fell from above $13 in mid-2008 to roughly $4 by 2011, and to a monthly-average low below $2.00 in April 2012, per EIA data. The thesis that had supported a leveraged $45 billion deal had been built on prices that were now visible only in the rear-view mirror.
The expiring hedges and 2011's $1.9 billion loss
Through 2008-2010 the hedge book absorbed the impact of falling spot prices on TCEH's economics. As the hedges rolled off, the company's revenues converged toward spot gas-driven clearing prices, and the gap between operating cash flow and debt service began to open. EFH reported a $1.9 billion loss in 2011. Cash flow from operations was no longer sufficient to fund the cash interest on the debt stack, and TCEH increasingly relied on payment-in-kind interest accruals at the EFH level to defer cash payments. The pace at which the structure was failing accelerated through 2012 and 2013.
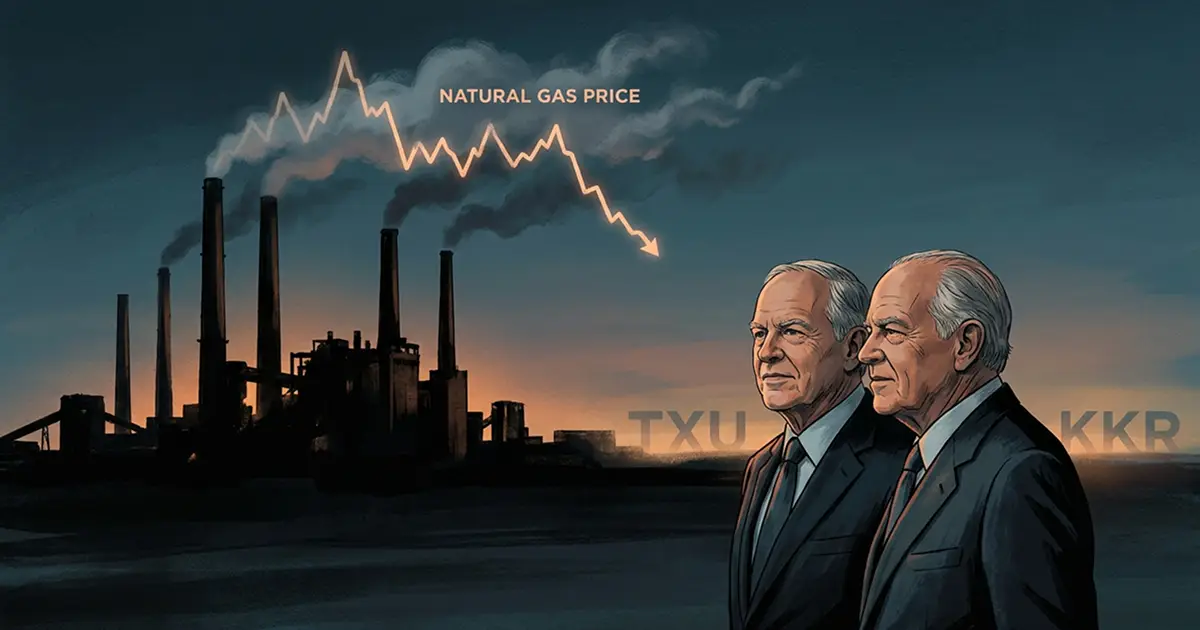
TXU value depends on the price of natural gas.
The most striking feature of the EFH collapse is that the warning had been published, plainly, at deal announcement. The thesis broke not because anyone failed to identify the risk but because the risk did not look quantitatively important in 2007.
Master the mechanics behind a deal answer: practice 1,000+ technical questions on LBO modeling, debt capacity, and financing structures, download our iOS app for the full toolkit.
How the Capital Structure Cracked
By 2010 the question was no longer whether the deal would default, but when and how. The next three years saw the most extensive series of distressed liability-management exercises ever attempted on a single corporate-debt complex.
PIK toggles, debt-for-debt swaps, and the 2010-2013 dance
EFH's capital structure included a series of PIK toggle notes at the holdco level: 11.250% cash-pay notes that the company could elect to pay in kind at 12.000% rather than in cash, issuing additional notes for the differential. The PIK toggle was designed precisely for the situation EFH found itself in by 2010: a cash-strapped issuer that needed to defer interest expense without triggering a default. EFH and TCEH executed multiple distressed debt exchanges between 2009 and 2013, swapping existing notes for new notes with lower face values, longer maturities, or higher seniority. The combined effect deleveraged the structure at the margin and bought time, but did not change the underlying reality that operating cash flows were inadequate to service the post-LBO debt stack.
- PIK toggle note
A debt instrument that gives the issuer the option, period by period, to pay interest either in cash or by issuing additional principal ("payment in kind"). PIK interest is typically priced at a premium to cash interest as compensation to the holder for the deferral. The instrument is most useful as a flexibility tool for issuers whose cash flows are highly volatile or expected to recover, and it is most dangerous when the underlying business does not recover.
In April 2013 EFH proposed a comprehensive restructuring that would have erased roughly $32 billion of debt and given senior creditors a combination of equity and cash. The proposal was rejected by senior creditors as inadequate. A 2014 attempt at a tax-efficient pre-pack also failed to bridge the gap between EFH and the bondholders. The doctrinal hardness of the problem was that there was no liability-management structure that could solve a commodity-price collapse without imposing real losses on senior debt.
The April 2014 Chapter 11 filing
Energy Future Holdings and 70 affiliates filed for Chapter 11 in the United States Bankruptcy Court for the District of Delaware on April 29, 2014. Total funded indebtedness was approximately $42 billion, per the Epiq case administration page. The filing was at the time the second-largest US public-utility Chapter 11 in history and one of the ten largest US corporate bankruptcies on record.
Kirkland & Ellis (Jamie Sprayregen, Chad Husnick, Steven Serajeddini, and Brian Schartz) served as debtor counsel; Evercore (William Hiltz, David Ying, Stephen Goldstein, Brendan Panda, and Sesh Raghavan) as financial adviser; Alvarez & Marsal as restructuring adviser. The bankruptcy proceedings ran for more than four years, longer than the operating thesis that had supported the original deal.
The Four-Year Chapter 11
The complexity of the restructuring was structural rather than operational. EFH's silo architecture meant that what could have been one bankruptcy became, in practice, three parallel reorganizations: TCEH on the competitive side, EFIH/Oncor on the regulated side, and an intercompany-claims fight that bridged them.
The TCEH and EFIH split that defined the case
The 2007 LBO had ring-fenced Oncor (the regulated transmission and distribution business) from TCEH (the competitive generation, wholesale, and retail business) so that creditors of one silo had no recourse to the other. The ring-fence had been the political condition for Texas regulatory approval. In bankruptcy, it became the binding constraint on the reorganization. TCEH's creditors and EFIH's creditors had no overlapping legal claims, and their economic interests were directly opposed: Oncor was a stable, regulated cash-generative asset that the TCEH creditors wanted access to, and the EFIH creditors wanted to insulate it from the TCEH estate's claims.
The result was a long and contested intercompany-claims litigation, alongside parallel auctions and restructuring proposals on each side. The legal expense alone reached the hundreds of millions of dollars. Whether the silo structure was a feature or a bug of the deal is debated: it preserved Oncor as a viable credit through the entire reorganization, which was the regulatory point of the structure, but the cost was an unusually long and procedurally expensive bankruptcy.
The asbestos claimants and the long-tail problem
Pre-LBO TXU subsidiaries had legacy asbestos exposure dating back decades. Late-filing asbestos claimants who had not filed proofs of claim by the original bar date became a third creditor pillar in the case. The Third Circuit's 2018 ruling in *In re Energy Future Holdings Corp.* on the right of late-filing asbestos claimants to file proofs of claim post-confirmation has since shaped how mass-tort-tail companies approach Chapter 11. The doctrinal outcome was that the bar date in a Chapter 11 plan does not, by itself, discharge unknown future claims with constitutionally adequate force unless notice was actually given.
Sempra wins Oncor, Vistra emerges from TCEH
TCEH emerged from Chapter 11 on October 3, 2016. First-lien debt of roughly $24.4 billion was converted into equity, leaving the reorganized company with materially lower leverage and a clean capital structure. On November 4, 2016, TCEH renamed itself Vistra Energy and prepared for a NYSE listing. The competitive side of the EFH legacy had been reorganized as a deleveraged Texas-focused generation and retail company.
The regulated-side path was longer. Hunt Consolidated Energy proposed a real-estate-investment-trust structure for Oncor in 2015-2016; the Public Utility Commission of Texas eventually approved the bid in 2016 but with conditions on the tax-windfall allocation that Hunt and EFH's creditors could not accept, and the transaction collapsed. NextEra Energy then offered roughly $18 billion for Oncor in 2017; the PUCT formally rejected that proposal in April 2017, this time on explicit ring-fencing concerns about linking Oncor's credit profile to its new parent. Sempra Energy ultimately won Oncor with a proposal that committed to maintain a strong ring-fence between Oncor and its new parent. The Sempra acquisition closed on March 9, 2018 at a total consideration of $9.45 billion for the 80.03% of Oncor that EFH owned, per Sempra's 8-K filing. EFH was renamed Sempra Texas Holdings.
| Stage | Entity | Outcome |
|---|---|---|
| 1957-2007 | TXU Corp. | Public Texas utility, ~462M shares outstanding by 2007 |
| 2007-2014 | Energy Future Holdings (LBO) | KKR/TPG/Goldman LBO; ~$8B equity; ~$40B debt |
| Apr 2014 | EFH Chapter 11 filing | $42B of debt; Delaware Bankruptcy Court |
| Oct 2016 | TCEH emerges as Vistra Energy | First-lien debt converted to equity; NYSE listing |
| Mar 2018 | Sempra acquires Oncor | $9.45B for 80.03%; EFH renamed Sempra Texas Holdings |
Go deeper before an interview: our 160-page PDF covers LBO frameworks, distressed-debt structures, and restructuring prep end-to-end, access the IB Interview Guide and pair it with these case studies.
Who Lost What
The reckoning runs through several distinct constituencies, and the published record is unusually complete because of the prominence of one of the creditors involved.
The sponsors: $8 billion of equity to zero
The sponsor consortium lost essentially all of its equity. KKR wrote off roughly 90% of its investment by the 2014 filing date, per D Magazine and the BSIC analysis. TPG and Goldman Sachs Capital Partners followed similar trajectories. The co-investors (Lehman Brothers, which had collapsed in 2008 with its EFH stake on the books; Citigroup; Morgan Stanley) similarly took full or near-full losses. The Vistra Energy emergence in 2016 returned no value to the original equity holders; the post-reorganization equity went to TCEH's first-lien creditors who had taken control of the estate.
In dollar terms, the ~$8 billion equity loss is among the largest single-deal private-equity losses in the industry's history. The relative scale matters too: at the time of the 2007 deal, the equity check was the largest single LBO equity commitment ever, and its loss reset what sponsors and limited partners were willing to underwrite at scale.
| Constituency | Approximate position | Recovery | Loss |
|---|---|---|---|
| Sponsor consortium (KKR/TPG/Goldman) | ~$8B equity | ~zero | ~$8B |
| Berkshire Hathaway | $2B bonds (cost) | $259M sale proceeds | $873M |
| Lehman Brothers (co-investor) | hundreds of millions | absorbed into Lehman estate | full |
| Citigroup / Morgan Stanley | co-investor stakes | minimal | substantially full |
| Other senior creditors (CLOs, debt funds) | tens of billions | partial via TCEH equity in 2016 | tens of billions in aggregate |
Buffett's $873 million admission
Berkshire Hathaway purchased approximately $2 billion of EFH bonds in 2007. Warren Buffett sold the bonds in 2013 for roughly $259 million, booking a pre-tax loss of $873 million. In his 2013 letter to Berkshire shareholders he wrote that the purchase had been made "without consulting with Charlie" (Munger), and described it plainly.
That was a big mistake.
The deal's lessons enter the public record in a way that few PE failures do, because Buffett is one of the few institutional creditors who routinely discloses his individual investment errors. Most other large-creditor losses on EFH were absorbed quietly by collateralized loan obligations, mutual-fund debt portfolios, and bank loan books that did not separately disclose the position. The $873 million Berkshire loss is the documented tip of a much larger creditor-side loss that, in aggregate, ran into the tens of billions.
The labor and ratepayer toll
The non-shareholder constituencies also absorbed costs. EFH reduced its workforce significantly across the 2011-2014 distress period. Texas ratepayers received the residential-rate reductions and price caps that had been negotiated as part of the political settlement; whether those benefits were better than what a non-LBO TXU would have delivered is the kind of counterfactual no one can prove. The clearest non-shareholder cost was the legal and administrative expense of the four-year bankruptcy, which is paid out of the bankruptcy estate and ultimately by creditor recoveries.
What the Largest LBO Ever Taught
The deal is the canonical case study in two distinct doctrines. One is about the structural risk of single-commodity LBOs. The other is about the upper bound on transaction size that the leveraged-finance market can support.
The one-way-bet problem
The deal is the cleanest published example of a leveraged buyout whose returns depended overwhelmingly on the direction of one commodity price. There was no operational lever the company could pull that would offset a 75% collapse in its key revenue driver. Cost-cutting could not bridge a multi-billion-dollar cash-flow gap. Operational excellence in generation could not change the marginal-fuel pricing dynamic of ERCOT. The thesis was not wrong about the business; it was wrong about the macro variable on which the business depended.
The doctrinal consequence is that post-EFH, large-scale commodity-exposed buyouts have been structured with materially more equity, longer hedge programs, and tighter covenant packages. The single-commodity-thesis LBO at peak-cycle prices is now treated by limited-partner advisory committees as a category that requires unusually strong evidence of risk control. The broader mechanics of how an LBO is structured, including the leverage trade-offs that EFH made wrong, are covered in our LBO modeling explainer and our debt-capacity analysis for LBO targets.
How big can an LBO be?
No leveraged buyout has reached the $45 billion scale of TXU/EFH in the years since. The 2013 take-private of Dell by Michael Dell and Silver Lake for about $24 billion, the 2013 Heinz acquisition by Berkshire and 3G Capital for $23 billion, and the 2007 Hilton take-private by Blackstone for $26 billion all reached the $20-25 billion range. None reached EFH's scale. The 2007 credit bubble enabled the EFH check size; subsequent credit cycles have offered comparable liquidity but no comparable transaction. The combination of underwriter caution after the EFH loss and the more conservative capital structures that limited partners now require has effectively set the upper bound on LBO size for a generation.
The TXU deal sits at the intersection of two distinct industry tracks (private equity and energy/utilities), and the modern context for either side is covered in our energy investment banking guide and our leveraged finance explainer. For traders and analysts on the distressed side, the broader distressed-debt and special situations primer covers the kinds of opportunities the EFH situation produced for funds positioned to buy bonds at the right point in the workout.
The verdict the record supports
Two things are now settled. The sponsor equity was wiped out completely, and the responsibility for that loss is split between an exogenous commodity shock (the shale-gas supply revolution) and an endogenous structural decision (an 80/20 capital structure on a single-commodity thesis at peak prices). Both factors were necessary; neither, alone, would have produced the same outcome.
What is not settled is whether the underlying thesis was unreasonable at the time. Sponsors and several finance-academic retrospectives have argued that the deal was a reasonable bet that lost; the doctrinal majority view (including the BSIC retrospective, the Motley Fool case study, and the Louisiana Law Review analysis) is that a leveraged single-commodity bet at peak prices was a structural error visible ex ante. Where sources disagree, the disagreement is in the document, not papered over.
For the candidate or analyst working through the deal, the case is best understood not as the worst LBO ever (sponsor losses can be relatively worse on smaller deals) but as the largest commodity-exposed leveraged-finance error in the modern record. The lesson is about structure: matching the leverage in a deal to the volatility of the underlying revenue driver, and pricing for the tail of that volatility rather than the base case. Every PE underwriting committee that has worked on a commodity-exposed deal since 2014 has done the EFH math in the room.
Sources
- 1TXU Corp., Form 8-K announcing the merger agreement, SEC EDGAR (February 26, 2007).
- 2TXU Corp., Form PREM14A merger proxy, SEC EDGAR (2007).
- 3CNN Money, "TXU agrees to record $45 billion private equity buyout" (February 26, 2007).
- 4NRDC, "Record TXU Buyout Includes Unprecedented Global Warming, Emissions Plan" (February 26, 2007).
- 5Atomic Insights, "TXU value depends on the price of natural gas".
- 6Bocconi Students Investment Club, "Vintage Private Equity Deals: TXU, Learnings from the Largest LBO (Bust) in History".
- 7D Magazine, "Why TXU Corp. Was a Bad Bet" (October 2012).
- 8The Motley Fool, "Energy Future Holdings: How the Biggest Leveraged Buyout In History Became a Disaster" (May 2015).
- 9Federal Reserve Bank of Dallas, Energy in the Eleventh District: Barnett Shale.
- 10Business Wire, "Energy Future Holdings Reaches Restructuring Agreement" (April 29, 2014).
- 11Epiq Global, Energy Future Holdings Chapter 11 Case Administration.
- 12Louisiana Law Review, "Energy Future Holdings Corp., the Second-Largest Public Utility Filing Ever, Poised to Finally Exit Bankruptcy".
- 13Berkshire Hathaway Inc., 2013 Annual Shareholder Letter.
- 14CNBC, "Warren Buffett admits to $873 million mistake" (March 1, 2014).
- 15Sempra Energy, Form 8-K, Closing of Oncor acquisition, SEC EDGAR (March 2018).